Why Pinch-A-Watt Is Needed
Electricity Usage Conservation
Studies have shown that more detailed electricity information to users can provide 10% and more conservation even over the long term. One Ontario study actually tracked this over one and a half years.
Smart Meters and several existing products provide whole house usage only which does not get down to the detail required for more significant conservation improvements.
Present products and implementations providing usage information are:
- Single whole house measurements
- Limited number (e.g. 3) of large appliance or section measurements often via current clamps
- Smart Appliances connected to receiver / gateway unit, (coming in 2011 or later)
- Spot application of plug-load modules
- Breaker panel level only monitoring
Utilizing the following chart and the analysis below it, we can see that without significant coverage of individual electricity usage points we fail to cover from 40% to 47% or more of the typical home electricity usage.
This large percentage is easily and economically covered by Pinch-A-Watt products along with the all the other usage points.
The Pinch-A-Watt collected data can be used stand-alone with our graphical reports or can compliment existing management systems that presently only monitor smaller portions of usage. These would include systems that work with Smart Appliances and Smart Meters.
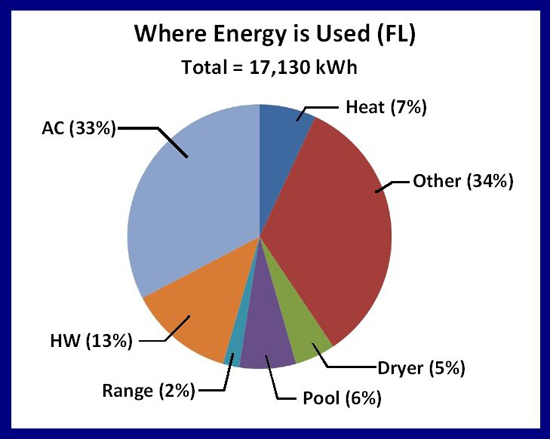
This chart is based on some information from the report "Energy Efficiency - The First Priority in Solving Energy Issues" by the Florida Solar Energy Center whose work in energy conservation is greatly appreciated.
This chart is data for Florida USA where HVAC, specifically air conditioning, is the most significant part of the usage.
Other sections of USA would either exchange the Air Conditioning section for heating or actually have reduced HVAC and thus an even larger percent of "other" un-monitored detailed usage.
USAGE CHART, one implementation scenario: In an all-electric home, current clamp and other systems could cover the AC, Heat and Hot Water portions leaving 47% of the usage unmonitored and thus unavailable for direct use / by the user for conservation improvements.
Smart Appliances & associated reporting systems when available would cover a portion of this 47% but only for some of the appliances and only when they become available and when existing appliance replacement is justifiable.
Plug-Load module systems could cover a portion of this 47% (not lights, fans, hard wired appliances), but at a significant cost & physical management if many devices were to be deployed. Pinch-A-Watt built-in technology would cover all of this 47% as well as all the other AC, Heat and Hot Water areas.